Introduction
This book is for anyone who has wondered how the stock market really works and has never had it explained plainly. You might have a workplace pension and no idea what it is invested in. You might have savings sitting in a bank account and a friend who keeps telling you to “get into shares”. You might have seen a video promising that a particular share or coin will make you rich, and felt both tempted and suspicious. Good. Suspicion is the right starting point.
The honest picture is this. Over long periods, shares in companies have rewarded patient owners better than cash or bonds, in every country with a continuous record since 1900. Over short periods, they can fall a long way, quickly, and stay down for years. Most professional fund managers fail to beat a simple index after their fees. And every year, ordinary people in Britain lose hundreds of millions of pounds to investment scams that borrow the language of the stock market. This book covers all of that, with the evidence.
How this book is built
Every chapter explains one part of the market, shows worked examples with the sums laid out, uses real data and real cases, and finishes with key takeaways and a checklist. If you are short of time, read the takeaways and do the checklist; come back for the reasoning when you need it.
Chapters 1 to 4 explain what shares are, how buying and selling works, what moves prices and how to read a company. Chapters 5 and 6 deal with risk, time, crashes and bubbles. Chapters 7 and 8 cover funds, fees and tax in the UK. Chapter 9 is for readers in Sri Lanka or with money there. Chapters 10 and 11 cover the two biggest dangers, other people’s scams and our own behaviour, and Chapter 12 turns it all into a simple one-page plan.
Throughout, you will find:
- Charts from published data. Figures come from sources such as S&P Dow Jones Indices, the UBS Global Investment Returns Yearbook, the Bank of England, the Financial Conduct Authority and the Central Bank of Sri Lanka. Each chart names its source.
- Real cases. These come from regulators and courts, such as the Financial Conduct Authority’s findings on the Woodford Equity Income Fund. Worked examples with invented names or numbers are clearly marked as illustrations.
- Numbered references. A small raised number after a fact points to the References section, so you can check the source yourself.
- A glossary and an index. Technical terms are explained when they first appear and collected in the Glossary.
A word about advice
This book is education, not financial advice. It does not tell you which shares, funds or platforms to buy, because it cannot know your circumstances, and because anyone who tells strangers what to buy should make you wary. The value of investments can fall as well as rise, and you may get back less than you put in. Past performance is not a reliable guide to the future.
Tax rates, allowances and rules are given “at the time of writing”, for the 2026/27 tax year, and they change. Before you act, check GOV.UK, the Financial Conduct Authority or, in Sri Lanka, the Securities and Exchange Commission, and for anything significant, take advice from a regulated financial adviser.
AI was used as a tool in preparing this book: as an assistant for drafting and checking, with every fact and source verified by hand.
What a Share Really Is
On 2 January 2026, the FTSE 100, the index that tracks the hundred largest companies on the London Stock Exchange, went above 10,000 points for the first time1. A few days later it closed above that level, at 10,004.57, after a year in which it had risen by more than 21%, its best year since 20092. When the index began on 3 January 1984, it was set at 1,0003.
Headlines like these make the stock market sound like a scoreboard. Numbers go up, numbers go down, and people on television explain why. But behind every number is something quite ordinary: millions of people buying and selling small pieces of real businesses. If you understand what one of those pieces is, most of the rest of this book will make sense.
This chapter explains what a share is, why companies sell them, the two ways shareholders can make or lose money, what an index like the FTSE 100 measures, and why the long-run record of shares is both encouraging and a warning.
A share is a slice of a business
A company is a business that exists in law separately from the people who own it. Its owners are its shareholders. If a company has issued 1,000 shares and you own 10 of them, you own 1% of the company. That gives you three things: a share of any profits the company decides to pay out, a vote on certain big decisions, and a claim on whatever is left if the company is ever wound up, after everyone it owes money to has been paid.
An illustration: Rosebank Bakes
This is an invented example. Two friends start a bakery as a limited company and issue 1,000 shares between them. After five years it makes £40,000 a year in profit after tax, and they want to open three more shops. They need £150,000. A bank will lend some, but they decide to sell 300 new shares to local investors at £500 each. Now there are 1,300 shares. Each new investor owns a small slice of a bigger business, and the founders own a smaller slice of it, but they have the money to grow.
The bakery example shows the basic deal. The company gets money it does not have to pay back. The investor gets part-ownership, with no promise of any return at all. If the new shops do well, the slice becomes more valuable. If they fail, the investors can lose everything they put in, but no more: as owners of a limited company, their loss is limited to what they paid for their shares.
Owning is not the same as lending
It helps to compare a share with the two other places people usually put money: a savings account and a bond.
| Savings account | Bond | Share | |
|---|---|---|---|
| What you are | A lender to a bank | A lender to a government or company | An owner of a company |
| What you are promised | Interest at a stated rate | Interest at a stated rate and your money back on a set date | Nothing; you share in profits and value if there are any |
| What happens if things go well | You still get only the interest | You still get only the interest | Your share of profits and value can grow without limit |
| What happens if things go badly | In the UK, up to £120,000 per bank is protected by the FSCS4 | You may get back less, or nothing, if the borrower fails | The share can fall in value, possibly to nothing |
| Who is paid first if the business fails | Depositors are protected | Lenders rank ahead of shareholders | Shareholders are paid last |
That last row is the heart of it. Shareholders take the most risk, because everyone else is paid first. In return, they get whatever is left over when the business does well, which over long periods has usually been more than lenders receive. We will look at the evidence later in this chapter and in Chapter 5.
Why companies list on a stock exchange
Most companies never sell shares to the public. Rosebank Bakes found its investors locally. But a large business that wants to raise a lot of money, or whose owners want to be able to sell their shares easily, may choose to list its shares on a stock exchange such as the London Stock Exchange or the Colombo Stock Exchange.
The first time a company sells shares to the public is called an initial public offering, or IPO. In 2025, for example, three companies listed on the Colombo Stock Exchange through IPOs5. The money from an IPO goes to the company, or to the existing owners who are selling.
After that, almost all trading is between investors. When you buy a share of a large company through an app or a broker, you are almost never buying it from the company. You are buying it from another investor who wants to sell. The company receives nothing from that trade. This is called the secondary market, and it is what people usually mean by “the stock market”.
Why does the secondary market matter to the company, then? Because it makes the company’s shares easy to buy and sell, which makes investors more willing to buy them in the first place, and it gives the company a public price that shows what investors think it is worth.
Two ways to make, or lose, money
A shareholder can gain in two ways: from dividends and from a rise in the share price. Both can disappoint.
A dividend is a payment a company makes to its shareholders out of its profits, usually once or twice a year. It is not guaranteed. A company can cut or cancel its dividend at any time, especially when profits fall. Some companies, especially fast-growing ones, pay no dividend at all and reinvest all their profits.
The second way is a change in the share price. If you buy a share for £5 and later sell it for £6, you have made a capital gain of £1. If you sell it for £4, you have made a loss of £1.
A worked example
Here is an illustration with round numbers. It is not a prediction of any real share.
You buy 100 shares in a company at £5.00 each, so you pay £500. Over the next year the company pays a dividend of 20p per share, which is £20 to you. At the end of the year the share price is £5.50.
- Dividend received: 100 × £0.20 = £20
- Gain in value: 100 × (£5.50 − £5.00) = £50
- Total return before costs and tax: £20 + £50 = £70, or £70 ÷ £500 = 14%
Now suppose instead that the share price falls to £4.00 by the end of the year, but the dividend is still paid.
- Dividend received: £20
- Fall in value: 100 × (£4.00 − £5.00) = −£100
- Total return: £20 − £100 = −£80, or −16%
The dividend softened the fall but did not stop it. Notice too that the £20 was 4% of what you paid (£20 ÷ £500). That figure is called the dividend yield, and you will see it quoted for almost every share. A high dividend yield can mean a generous company; it can also mean that the share price has fallen because investors expect trouble, which pushes the yield up. Chapter 3 returns to this.
In real life you would also pay dealing costs and, outside a tax-free account such as an ISA, possibly tax on dividends and gains. Chapter 2 covers costs and Chapter 8 covers tax.
What an index measures
An index is a single number that summarises the prices of a group of shares. The FTSE 100 includes the hundred largest companies listed in London, weighted by their size, so a big company moves the index more than a small one. In Sri Lanka, the All Share Price Index, or ASPI, covers every company listed on the Colombo Stock Exchange, and the S&P Sri Lanka 20 tracks twenty large ones.
An index is useful as a thermometer: it tells you, roughly, how the market as a whole has done. It is also the basis of index tracker funds, which simply try to copy an index, and which Chapter 7 looks at in detail.
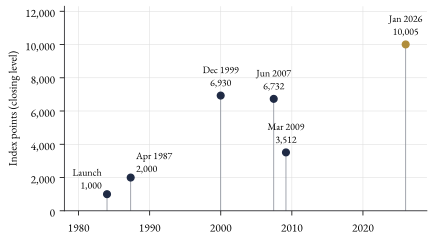
The chart shows a handful of landmark levels. It took a little over three years to go from 1,000 to 2,000, which it first passed on 30 April 19873. It reached a record of about 6,930 at the end of 19996. It then fell, recovered to about 6,732 in June 2007, and fell again to 3,512 in March 2009 during the financial crisis, nearly half below that peak6. And in January 2026 it passed 10,000.
Two warnings hidden in that chart
First, the long climb hides long periods of going nowhere. The FTSE 100 first reached 6,000 in March 1998 and did not reach 7,000 until 2015: 6,206 days, about seventeen years1. Someone who invested a lump sum near the top in 1999 and needed the money a few years later would have had a miserable experience.
Second, the FTSE 100 is a price index. It shows only share prices and ignores the dividends companies paid along the way. For British companies, which have tended to pay generous dividends, that leaves out a large part of what owners actually received. An investor who reinvested dividends did considerably better than the index level alone suggests. When you compare investments, always check whether a figure includes dividends; a total return figure does.
What the long run shows
The best-known long record of investment returns is the UBS Global Investment Returns Yearbook, compiled by Elroy Dimson, Paul Marsh and Mike Staunton, which covers 35 markets, most of them from 1900 onwards7. Its 2026 edition illustrates the difference between owning and lending with one example: one US dollar invested in American shares at the start of 1900, with dividends reinvested, would have grown to $124,854 by the end of 2025. The same dollar in long-term government bonds would have grown to $284, and in short-term Treasury bills to $697.
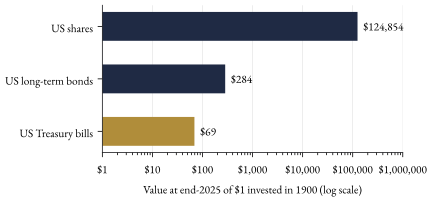
Those numbers are before inflation, which ate away most of the value of money over 126 years. After inflation, American shares returned about 6.6% a year, bonds 1.6% and bills 0.5%8. The authors also found that shares beat bonds, bills and inflation in every country with a continuous investment history since 19007.
That is the encouraging part. The warning is in the same report: shares and bonds have on several occasions lost more than 70% of their value in real terms8. The figures above are also for the United States, which was an unusually successful market over the period; other countries did less well. Long-run averages are real, but nobody gets the average. You get the particular years you happened to be invested, in the particular markets you chose.
Why so many people keep their money in cash
Many people with savings never take this risk at all. The Financial Conduct Authority’s Financial Lives survey found that 61% of UK adults with more than £10,000 of investible assets held at least three-quarters of it in cash9. The same survey found that one in ten people had no cash savings at all.
Holding cash is not foolish. Money you will need in the next few years, and an emergency fund, belong somewhere safe and easy to reach, for reasons Chapter 12 explains. The question this book helps you answer is a narrower one: for money you will not need for many years, do you understand the trade-off well enough to make your own decision, rather than leaving it in cash by default or handing it to the first person who promises a high return?
- A share is a slice of ownership in a company. Shareholders are paid last, so they take the most risk, and they keep what is left when things go well.
- Most share trading is between investors on the secondary market. The company only receives money when it issues new shares, for example in an IPO.
- You can make or lose money from dividends and from changes in the share price. Neither is guaranteed. Add them together for the total return.
- An index such as the FTSE 100 or the ASPI summarises a market. The FTSE 100 is a price index and leaves out dividends.
- Over the very long run shares have beaten cash and bonds in every country with a continuous record since 1900, but there have been falls of more than 70% and periods of many years with no gain.
- Find out whether you already own shares indirectly, for example through a workplace pension, and roughly how much is in it.
- Write down how much of your savings you might need in the next five years. That money is not for the stock market.
- Look up the FTSE 100 (or, in Sri Lanka, the ASPI) and note today’s level, so the rest of this book has a real reference point.
- Work through the dividend-and-price example in this chapter with your own round numbers, including a loss.
- When you next see an investment advertised, check whether its figures include dividends and whether they are before or after costs.
- Note any investment promise you have been offered recently; you will test it against Chapter 10.
References for this sample
- AJ Bell (2026). FTSE hits 10,000: flagship UK stock market index goes to another level as 2026 starts with a smile. Press release, 2 January 2026. https://www.ajbell.co.uk/group/news/ftse-hits-10000-flagship-uk-stock-market-index-goes-another-level-2026-starts-smile (accessed November 2026).
- FTSE Russell via Mondo Visione (2026). FTSE 100 tops 10,000 for the first time at market close. 5 January 2026. https://mondovisione.com/news/ftse-100-tops-10000-for-the-first-time-at-market-close-202615 (accessed November 2026).
- Raconteur (2024). The FTSE 100 at 40. https://www.raconteur.net/growth-strategies/ftse-100-40-years (accessed November 2026).
- Financial Services Compensation Scheme. What we cover. https://fscs.org.uk/what-we-cover (accessed November 2026).
- Daily FT (2026). CSE ends year on the up; ASPI gains 42% in 2025 and generates Rs. 2.4 t value. 1 January 2026. https://www.ft.lk/financial-services/CSE-ends-year-on-the-up-ASPI-gains-42-in-2025-and-generates-Rs-2-4-t-value/42-786362 (accessed November 2026).
- MoneyWeek. The biggest lesson that 2007 can teach investors. https://moneyweek.com/475360/the-biggest-lesson-that-2007-can-teach-investors (accessed November 2026).
- UBS (2026). Global Investment Returns Yearbook 2026: Timeless lessons for today's investment challenges. Press release, 3 March 2026 (E. Dimson, P. Marsh and M. Staunton). https://www.ubs.com/global/en/media/display-page-ndp/en-20260303-global-investment-returns-yearbook-2026.html (accessed November 2026).
- Dimson, E., Marsh, P. and Staunton, M. (2026). UBS Global Investment Returns Yearbook 2026: Summary Edition. UBS. https://www.ubs.com/content/dam/assets/wm/static/cio/documents/giry2026-summary-public.pdf (accessed November 2026).
- Financial Conduct Authority (2025). More people have bank accounts but one in ten have no cash savings, FCA survey reveals (Financial Lives 2024). Press release, 16 May 2025. https://www.fca.org.uk/news/press-releases/more-people-have-bank-accounts-one-ten-have-no-cash-savings (accessed November 2026).